Features Introduced in ELM 6.7
This new release includes several new enhancements for ease of use, new features, better performance and reliability to name just a few. Monitoring server performance and event logs and the vast data available is now even easier thanks to version 6.7.
This latest version of ELM pushes the bar even higher with an updated and improved Console layout, new features such as Event Correlation, and Maintenance Windows.
Listed below you'll find the highlights of the newest features in ELM Enterprise Manager 6.7.
ELM Console UI Updates - Monitoring, Categories, Views & More
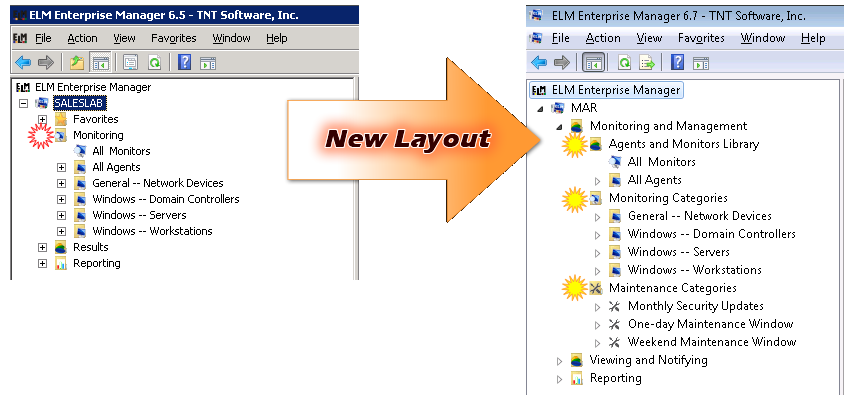
Right away you'll notice some great improvements with ELM the first time you launch the console. We've restructured the categories to provide better organization and management of your systems as well as the monitoring features within. From the top you'll see that the 'Monitoring' category has been broken out into 'Monitoring and Management', 'Monitoring Categories', and 'Maintenance Categories'.
The Agents and Monitors Library contains the All Agents Container as well as the list of All Monitors available within ELM (based on your licensing).
Monitoring Categories are the new landing place for the contents of the old Monitoring Container - familiar ground.
Maintenance Categories is a new feature introduced with version 6.7 and is described in more detail below.
In the next section be sure to take a look at how the Results container has been removed and Event Views have been expanded and improved!
Event Views, Security Views & Filters
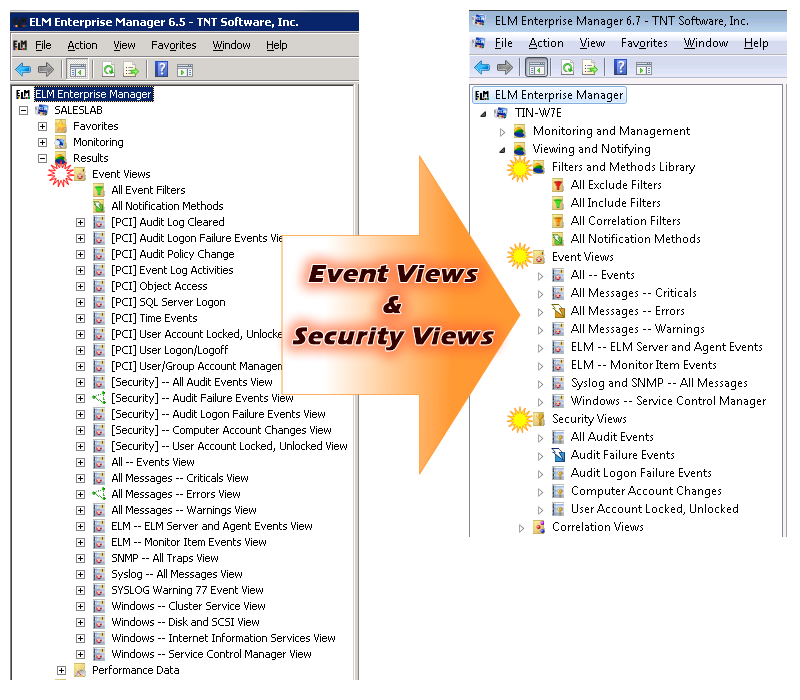
With the ever growing importance of categorizing events for operational and forensic use, the Event Views in ELM have been reorganized and streamlined. In ELM 6.7 the Event Views have been separated from Security Views providing easier access and visibility. The Event Filters and Notification Methods have also been grouped together into their own container or "Library" as it is called.
In the sample below you can see the difference between the ELM 6.5 and ELM 6.7 console layout. Starting at the top, there is the Viewing and Notifying top level container that includes:
Filters And Methods Library - The Filters and Methods Library is the home of all Filters, both Exclude and Include, as well as Correlation specific Filters. All Notification Methods available can also be found here. A new feature in ELM 6.7 is that Exclude and Include Filters are no separate from one another for easier distinction of their use within the product.
Event Views - These are the same Event Views that ELM is famous for, but now they are in their own unique container for a cleaner appearance resulting in a shorter list.
Security Views - The Security Views in ELM are slightly different than a normal Event View. Not only are they configured to display only the security events that come in but they also display different columns of data for these events, specifically related to security, within the View itself.
Correlation Views - Correlation Views are new with the release of ELM 6.7. Please see the section below for more details on Event Correlation.
Event Correlation - Correlation Views
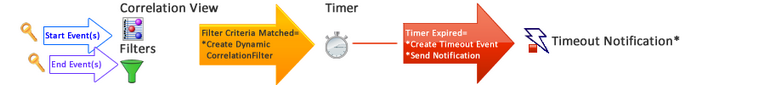
This new feature is based on Views and combines Filters for 'Start' events together with advanced filters and automated timers for 'End' Events to provide a powerful forensic tool for your environment.
Correlation Views can be used a number of different ways.
When an event matches the Include Filter, it is designated as the "start event" and the timer begins counting down. If an event matching the Correlation Filter is found before the timer expires, then it is designated as the "end event" and a correlation pair has been found. A Notification Method can be assigned to alert ELM users that a match or pair has been found.
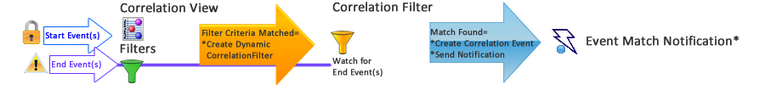
Alternatively, if the timer counts down to zero, then a separate Notification Method can be triggered alerting ELM users that a correlation pair was not found.
Some samples of how Event Correlation could be used in ELM include:
•Server reboot takes too long
•Service restart is too slow
•Object Access events
For more information on Event Correlation, click here.
Maintenance Window - Categories
When it comes time for system maintenance and planned down time, the last thing you want is an overload of notifications from ELM telling you about problems or unavailability of those systems you are already aware of.
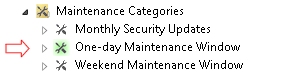
A new feature introduced in ELM Enterprise Manager 6.7 is the ability to add a "Maintenance Window" by using what we refer to as Maintenance Categories. These categories pause the launching of notifications during scheduled maintenance when the systems may be offline or generating events which would unnecessarily trigger notifications.
ELM will continue to monitor the systems you assign to Maintenance Categories during your maintenance window periods, you just don't have the frustration of being barraged by notification methods during the configured time period. Time periods can be one-offs or regularly intervals based on your maintenance calendar and needs.
Maintenance Categories, as well as Agents within Maintenance Categories, that are currently active are represented by a glowing icon in the console.
New Formats, Options and More in ELM Editor Reporting
New Reporting Formats
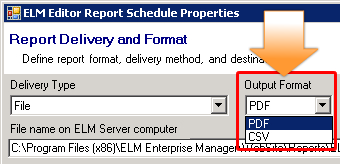
The ELM Editor reporting engine features some great new improvements that users will surely appreciate. To start with the file output type has been upgraded and options now include the popular PDF format as well as CSV (comma separated values) format. These new formats will allow users to distribute and manipulate reports to their liking even more easily!
Assign Reports to Categories
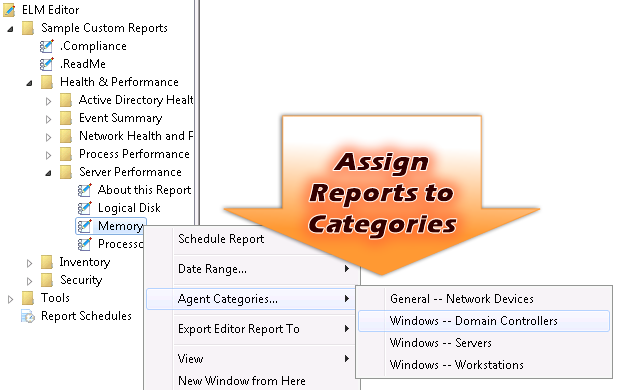
ELM Editor now allows you to quickly and easily assign reports to specific Monitoring Categories or groups of systems within your environment. This new shortcut option makes customizing reports even easier!
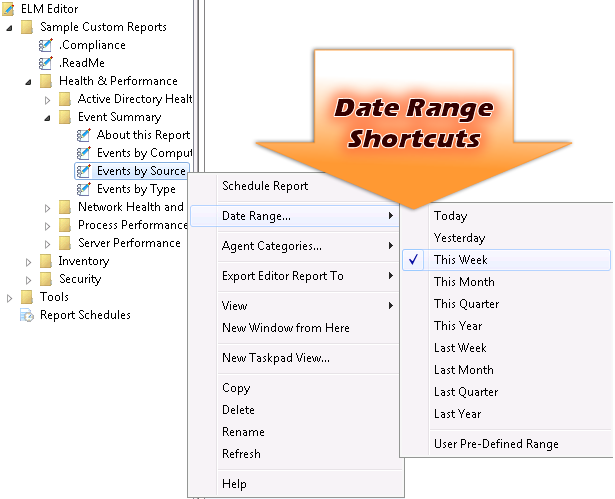
Select Reporting Time Frames With Ease
Adjusting reporting time frames within ELM Editor used to require editing of the SQL queries. Now with the release of ELM 6.7, adjusting the time frames for your reports is simple with built-in shortcuts. These can be used to quickly produce and deliver a report for a specific time frame. When you're done, you can revert back to any custom time frames you had for each report section by choosing the 'User Pre-defined Range' option.
Faster Report Previews
ELM Editor reports within the ELM Console will now display much faster by showing a preview of the data rather than all of the data available. This is accomplished by using 'Top Clause' filtering. A smaller cross section of the data is shown, allowing you to take a quick look at the report layout and formatting, make any changes necessary and review the results quickly. Once the report is scheduled or the date range changed, the top clause is automatically removed so that you get all data available displayed.
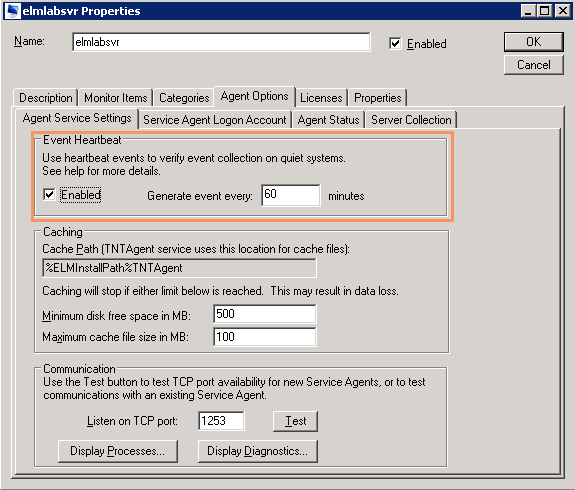
Heartbeat Event in Agent Properties
Service Agents now have a new feature for more complete end-to-end monitoring - which is especially helpful on some quieter systems.
The Event Heartbeat, found in the Agent properties, allows the system to generate a specific heartbeat event at a time interval you specify, on an on-going basis. ELM can be configured to look for this event to verify the system is up and running and generating events, and they are being collected. A full loop self-check monitoring cycle so to speak.
This new Heartbeat Event is very valuable in large, highly scaled environments where there may be hundreds of systems reporting in to ELM.