Create Visibility Into Your VM Performance with ELM’s Categories and Dashboard
ELM Enterprise Manager comes preconfigured with several monitoring categories to help organize systems into logical groups. You can also create customized categories with corresponding monitoring templates, or simply use monitoring categories to organize how you view systems in the dashboard.
In this example we’ll show you how and share some ideas for organizing your virtual machines in conjunction with their physical host.
Let’s face it, if you don’t have to interact with some virtualized servers for any length of time you may forget where they’re located. When it comes time for maintenance, updates, or other changes a cheat sheet may be handy since most of us don’t have a photographic memory for which host and Hyper-V Manager you need to access to make adjustments. ELM can help you here along with providing a snapshot of performance metrics of all the VM’s on a single host.
To begin, we’ll open the ELM Console (MMC) and navigate down to our Monitoring Categories and expand.
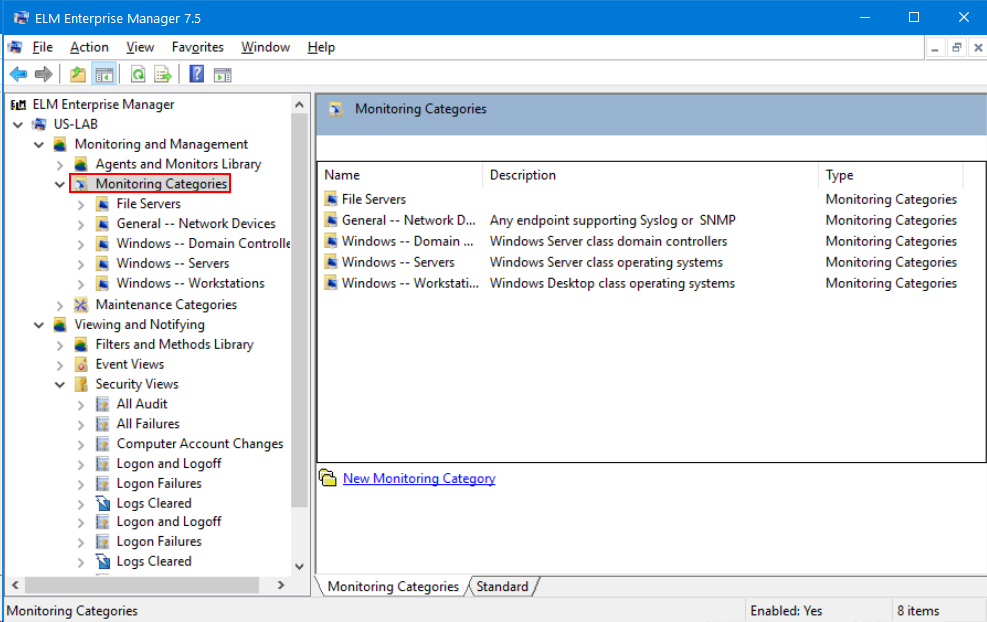
Here we’ll see the defaults and click the link to launch a New Monitoring Category wizard.
We’ll walk through the wizard and apply some details to our Name and Description.
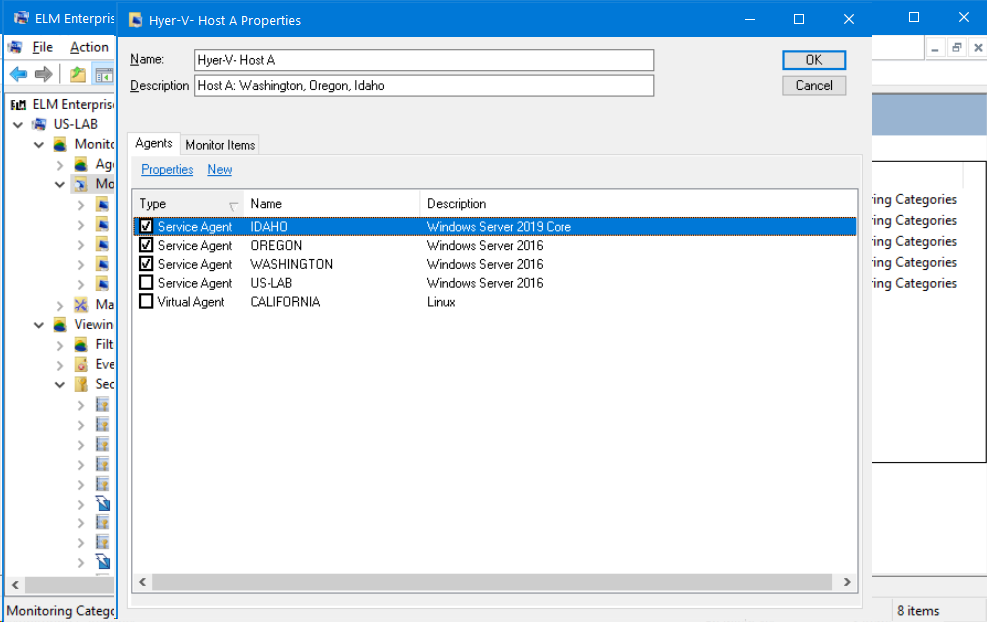
Name: This will be the same as the name of our Hyper-V Host that supports the VM’s we’ll be assigning to this category. In this case we’ll call it: Hyper-V Host A”.
Description: Here we’ll list out all the VM’s on this host. Washington, Oregon and Idaho.
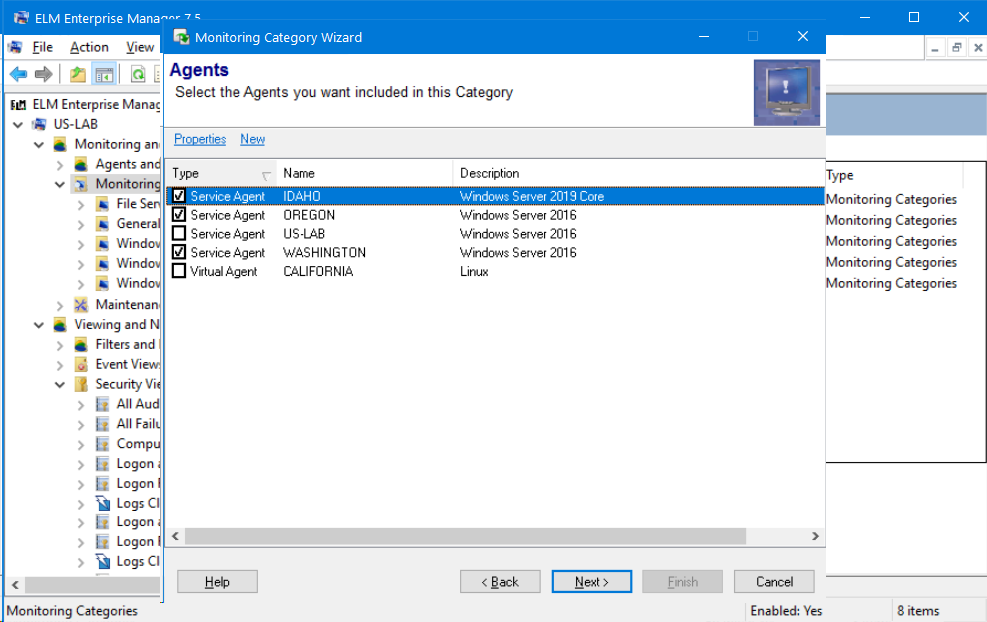
The next step will be to actually assign these agents from the Description to this Monitoring Category.
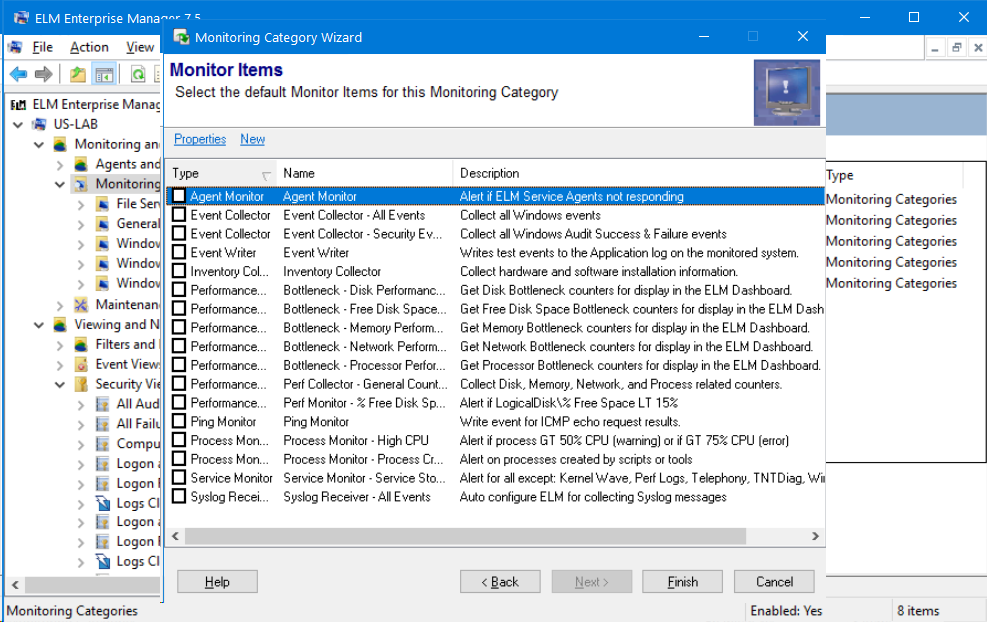
Now we can assign specific monitoring items to this category. By default these agents will already pickup the monitoring items assigned to All Agents or any monitor items in other categories these Agents also belong to. For demonstration purposes we’re going to leave these alone as we’re just showing an organizational trick in this example.
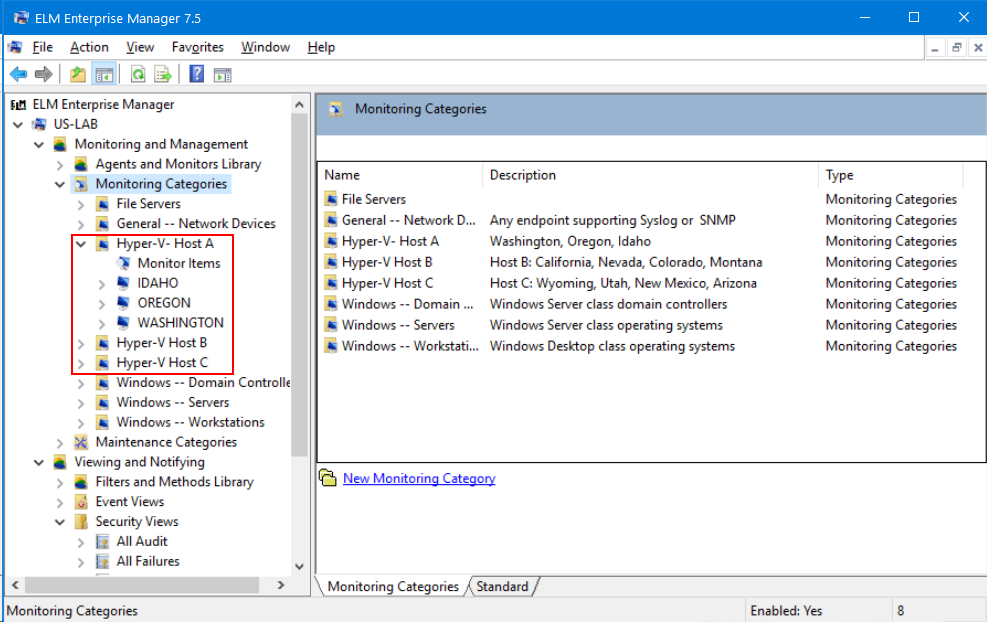
Once we click Finish, the new Monitoring Category will appear in the left pane of the console. We’ll go ahead and create a few more categories while we’re here called Hyper-V Host B and Hyper-V Host C.
Now we see each of the new Hyper-V monitoring categories we’ve created and if we expand one, the VMs within each.
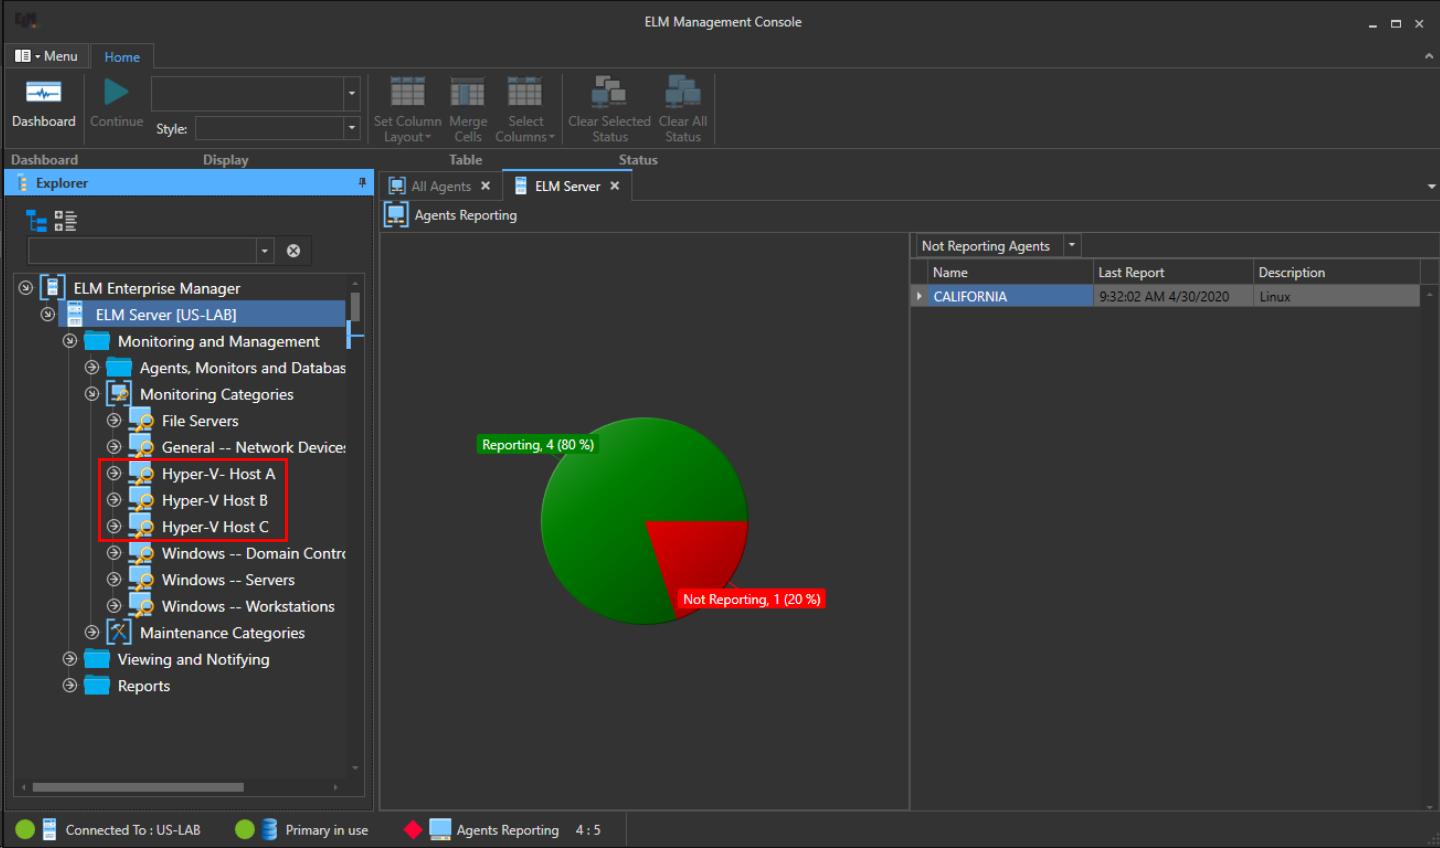
From here we will switch over to the ELM Management Console and expand the Monitoring Categories in the left pane. We can see that the ELM Management Console mimic the contents of the MMC.
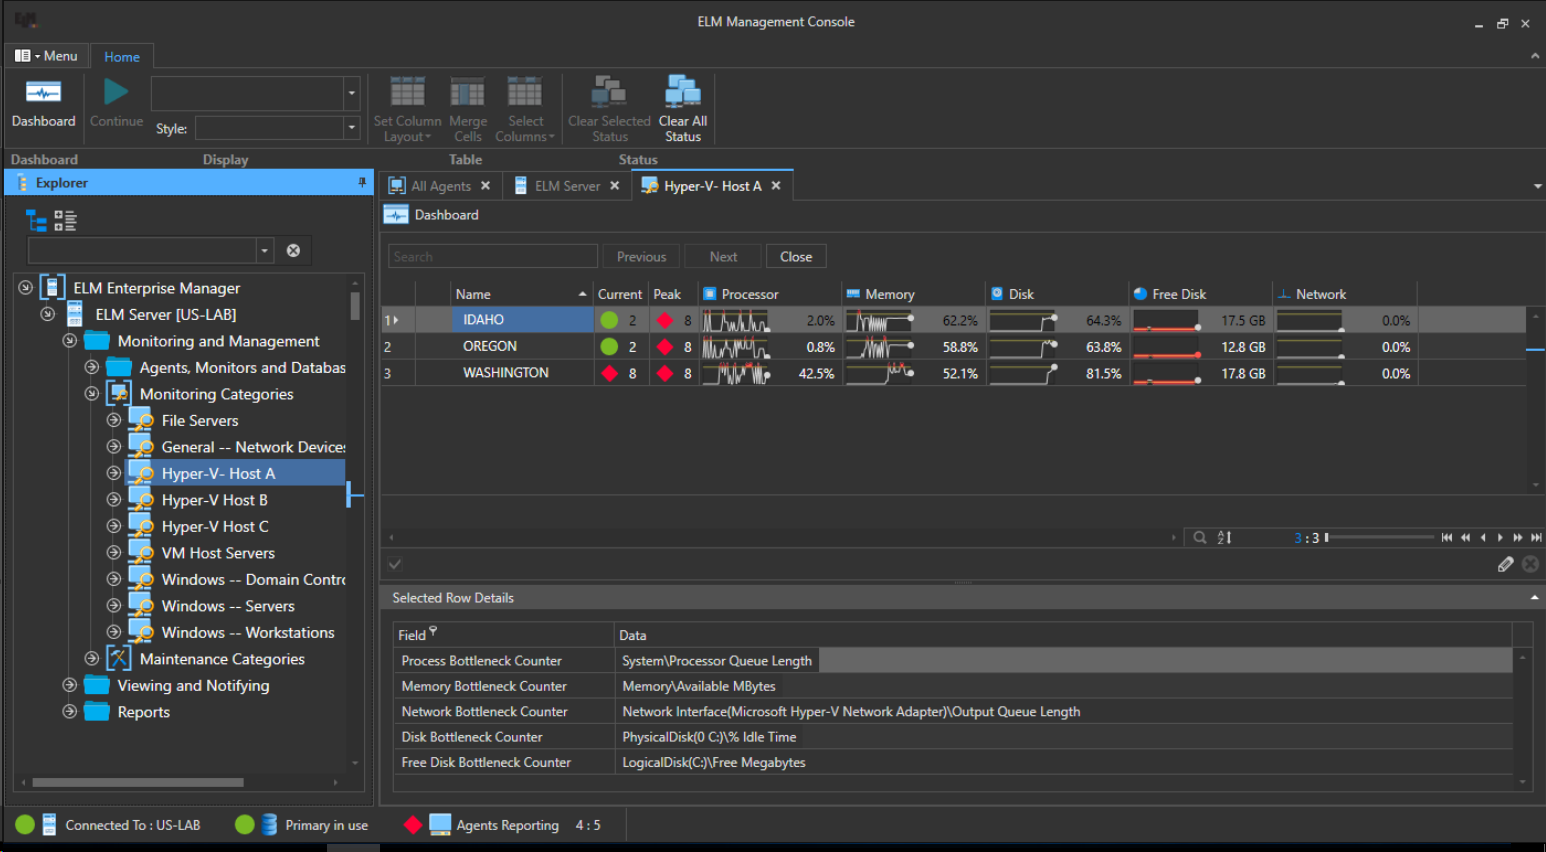
Now we’ll double click on the “Hyper-V Host A” monitoring category we just created and a new Document will open in the main screen displaying each of the VMs assigned to this category (and host). From the dashboard view we get an immediate overview of current status, processor, memory, disk, free disk and network metrics and we can drill down into any system listed from here for more details.
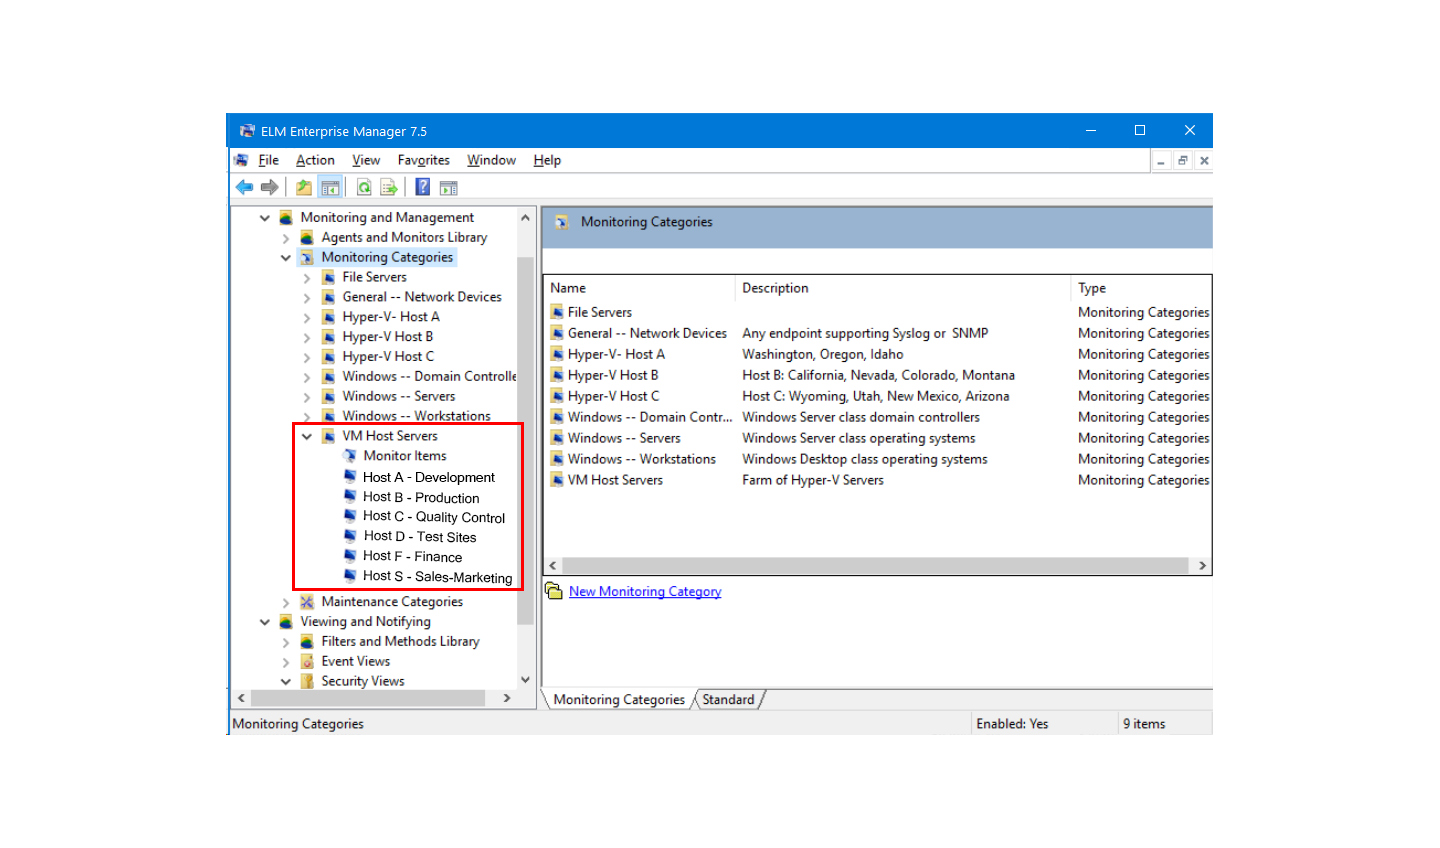
This same approach can be used to create a monitoring category for all of the host hardware that is running the VMs. You would create a new monitoring category labeled appropriately and then assign the specific host machines to it, providing the ability for a single view of host system resources.
We hope that you found this article on using categories to organize virtual machines useful and wish you continued success with ELM.

